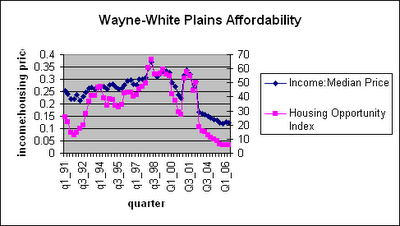
The NAHB released data, and I made charts. Housing affordability in the Wayne-White Plains MSA (which includes Manhattan) spiked after 9/11 and is now half its previous nadir for the years since Q191. It's plotted against the ratio of median income to price to show the impact of
 interest rates.
The second plot shows how afforability nationally has fared over the same period. It's plotted against the percentage of adjustable rate mortgages, which has been dropping, although not fast enough to keep us out of the crapper. Anyway, I said a bunch of predictable things based on those plots and the associated data tables.
No comments:
Post a Comment